Many car owners in the UK have never given a second thought to how much money they spend maintaining their vehicles. The best estimates are that you would spend around £3,100 a year on car ownership costs, and this is separate from the purchase price when you bought the car.
The biggest car expenses
The biggest expense by far is having to top up your car with fuel. On average, most people spend around £1,000 a year on either petrol or diesel. It could be slightly less than this, or more depending on how much you drive, but typical drivers tend to spend this amount.
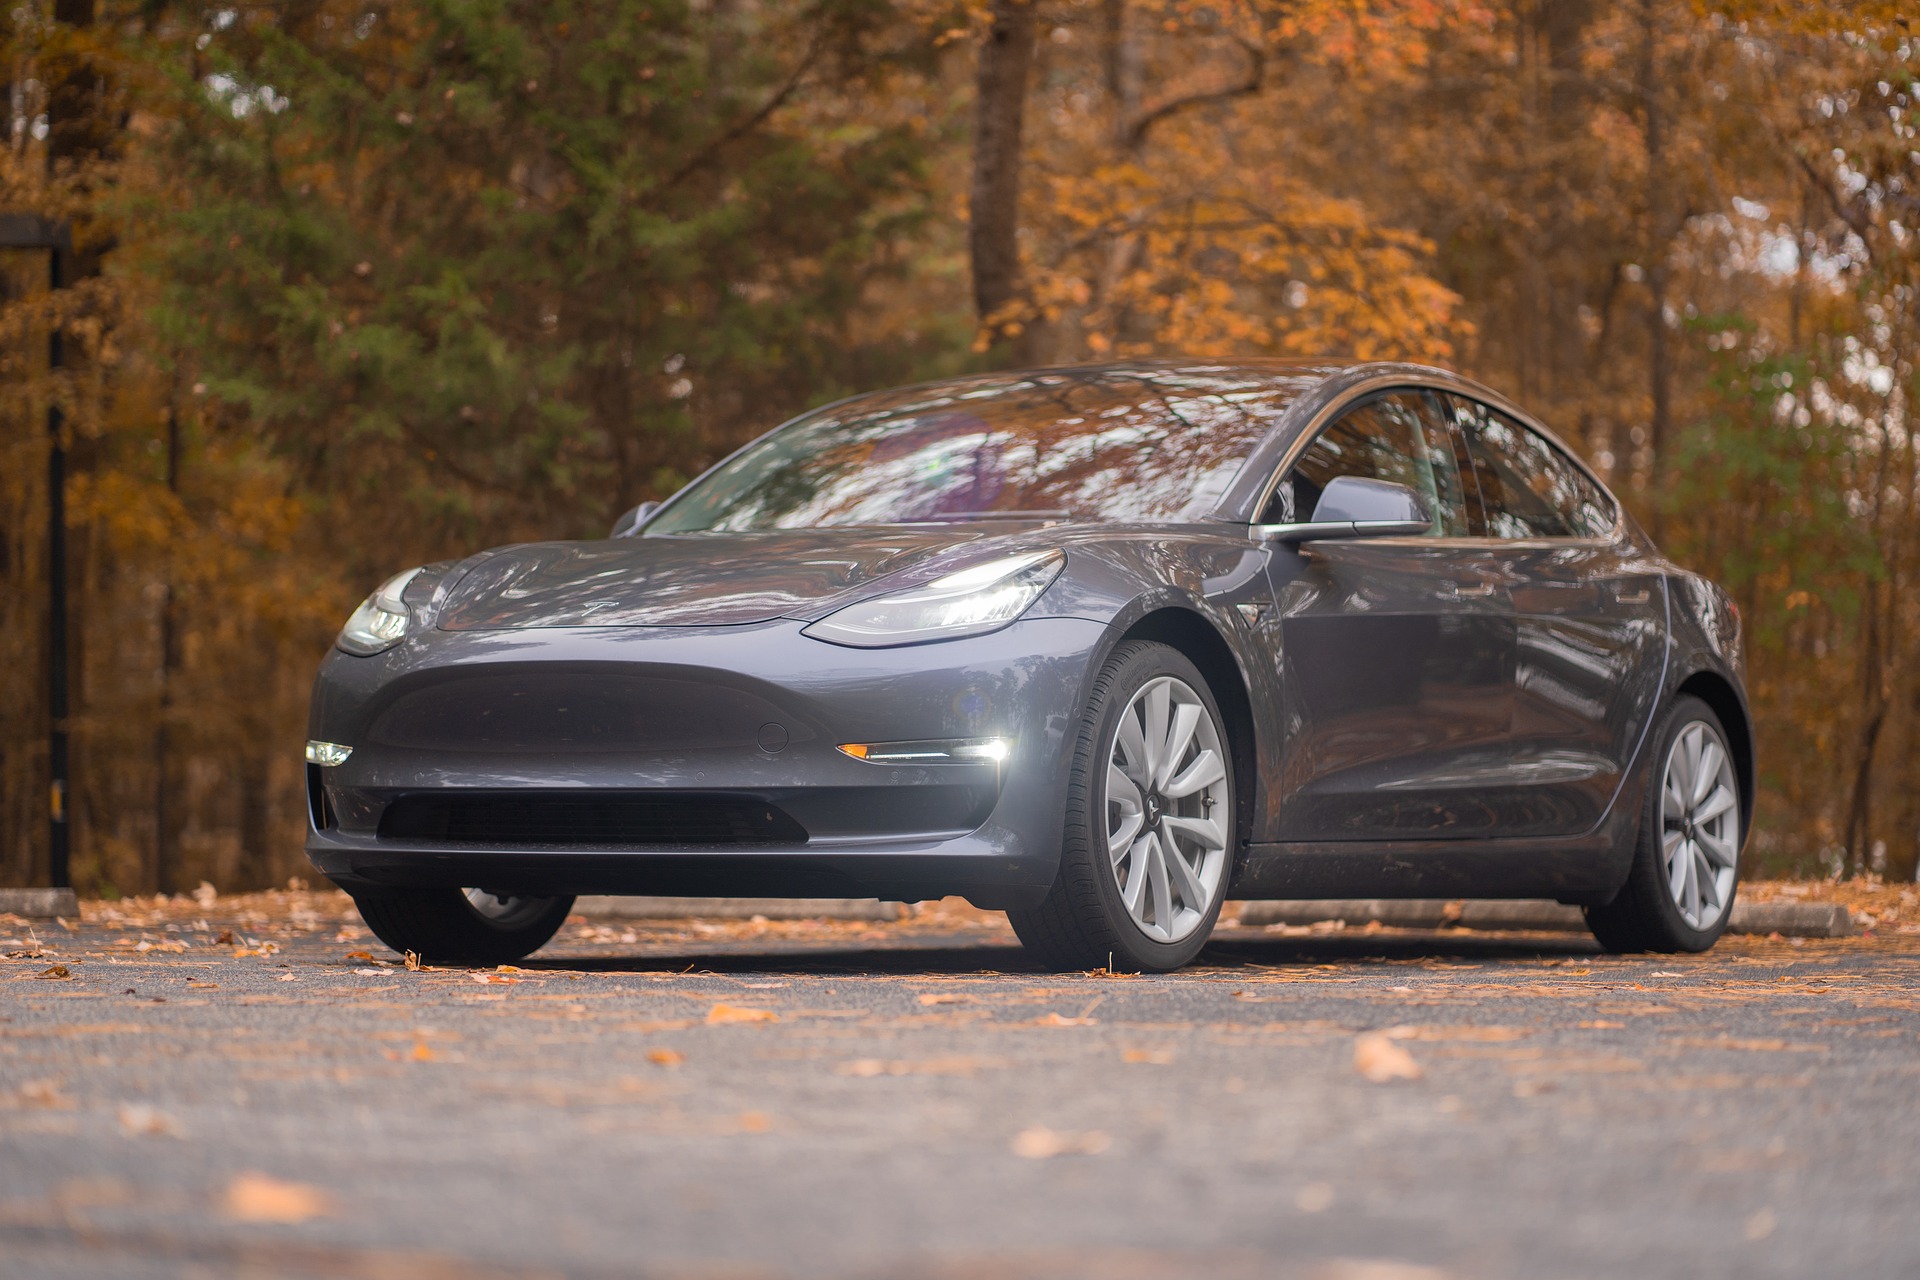
Of course, if you have an electric vehicle, these costs can be dramatically reduced.
Car Insurance
The price of insurance will wildly differ for everyone, as car insurance is priced based on many factors. Nimblefins state that the average annual car insurance policy for people with no claims or convictions is just under £500. Many people pay much more than this, such as new drivers, those with points on their licence or a previous driving ban, and many other factors. There are many reasons why the cost of your car insurance could be above average. Either way, car insurance is one of the many costs of keeping a car.
Below is a table showing our minimum and average prices for different types of car insurance, just to show how varied it can be.
| Product | Lowest Price | Highest Price |
| Insurance for convicted drivers | £304.19 | £2,016.83 |
| Fast Food delivery drivers | £924 | £1824.61 |
| Business Car Insurance | £325 | £1465.72 |
March 2020 – March 2021
There can even be vast differences between the products themselves. For example, insurance for convicted drivers would include people with just one speeding conviction, as well as people with multiple drink-driving convictions and bans and everything in between. It is impossible to give a basic figure on how much car insurance costs, but you would need to look at your own situation insurance-wise and be able to budget for it.
Servicing your car
The average amount to service or repair your car per year is between £250 and £300. However, just like car insurance, this can vary massively. Newer cars, for example, are not as likely to come across any issues that need repairing, whereas the opposite can be said about older cars. Also, in the life span of your car, no two years would be the same, service-wise. Your car could need major repairs one year, which could cost a lot of money, and the next year, everything could be fine. This means it can be difficult to calculate an average annual expense.
Other expenses
There are other, smaller expenses which also add to the annual cost of maintaining a car. They may not seem like much, but it can add up. These things include:
- Road tax
- Car Washing
- Necessities such as antifreeze, wiper fluid, tools, etc.
- Any fines you may receive.
- Car parking costs/permits
FAQs
How much does it cost per mile for petrol/diesel?
How much you spend on fuel will depend on factors such as your car’s fuel efficiency and how much you drive. The tables below feature data from the UK government website and are accurate as of March 2021.
Petrol
| Engine Size (cc) | Mean MPG (Miles per gallon) | Applied MPG | Fuel Price (Per litre) | Fuel Price (Per gallon) | Rate Per Mile |
| Up to 1400 | 57 | 52.7 | £1.21 | £5.48 | 10 pence |
| 1401 – 2000 | 48.2 | 44.6 | £1.21 | £5.48 | 12 pence |
| Over 2000 | 32.7 | 30.3 | £1.21 | £5.48 | 18 pence |
Diesel
| Engine Size (cc) | Mean MPG (Miles per gallon) | Applied MPG | Fuel Price (Per litre) | Fuel Price (Per gallon) | Rate per mile |
| up to 1400 | 71.3 | 65.9 | £1.25 | £5.68 | 9 pence |
| 1401 – 2000 | 57.9 | 53.4 | £1.25 | £5.68 | 11 pence |
| Over 2000 | 49.8 | 45.8 | £1.25 | £5.68 | 12 pence |
Regarding pricing, numbers have been rounded to the nearest whole pence.
For information on electric cars, see our electric car blog.
As you can see from the tables above, diesel is more expensive than petrol, but diesel cars are more fuel efficient. This means that in the long run, fuel-wise, it is cheaper to own a diesel car.
How many cars in the UK are Diesel?
Data sourced from Statista, which was true as of January 2020, show us the breakdown of cars in the UK;
63.5% – Petrol
25.7% – Diesel
10.70% – Electric
How many cars per household in the UK?
There are currently around 1.2 cars per household in the UK.
While it can differ for everyone, the average yearly cost of owning a car is around £3,000, which does not include the price of the car. So, it is always best to work out your finances before you purchase a car to see if you can afford to keep and maintain it throughout the year.
Nimblefins has sourced some of the data from this blog.